Thesis: Increasing economic growth, as measured by GDP, negatively impacts environmental sustainability. Alternative indicators beyond GDP can provide a more comprehensive assessment of progress.
Introduction:
In recent times the world has been so focused on economic growth that it often negates all the negatives that this presents. One of the problems is that currently, economic growth is not sustainable. Rapid economic growth usually leads to pollution, greenhouse gas emissions, and increased resource consumption. Balancing sustainability and economic growth is essential for long-term well-being. While GDP has traditionally been the primary measure of progress, alternatives must be explored that account for environmental impact. Prioritizing sustainability involves reducing negative environmental effects while ensuring economic stability and social equity.
During the World Economic Forum in Davos, Switzerland, Critics pointed to a contradiction that they said the corporate world had been unable to resolve: how to assuage the appetite for economic growth, based on gross domestic product, with the urgent need to check carbon emissions. “It’s truly a contradiction,” said Johan Rockström, director of the Potsdam Institute for Climate Impact Research. “It’s difficult to see if the current G.D.P.-based economic growth model can go hand-in-hand with the rapid cutting of emissions,” he said. (Sengupta 2020)
Economic Growth:
Economic growth is an increase in the services and production of goods in one period of time compared with a previous period. It can be studied in real or nominal terms. Normally, economic growth is measured in gross domestic product (GDP) or gross national product (GNP).
Environmental sustainability:
Environmental sustainability is the ability to conserve natural resources and maintain an ecological balance in our planet’s natural environment to support the well-being of current and future generations. The National Environmental Policy Act of 1969 committed the United States to sustainability, declaring it a national policy “to create and maintain conditions under which humans and nature can exist in productive harmony, that permit fulfilling the social, economic and other requirements of present and future generations.”
The Relationship Between Economic Growth and Environmental Sustainability:
Environmental Degradation and Resource Depletion
The impact of economic growth on the environment includes loss of environmental habitats, global warming, higher levels of pollution, and increased consumption of nonrenewable resources. The speed of global economic growth in the past century has led to a decline in the availability of natural resources such as forests, oil, coal, and gas, loss of fishing stocks, and loss of species diversity.
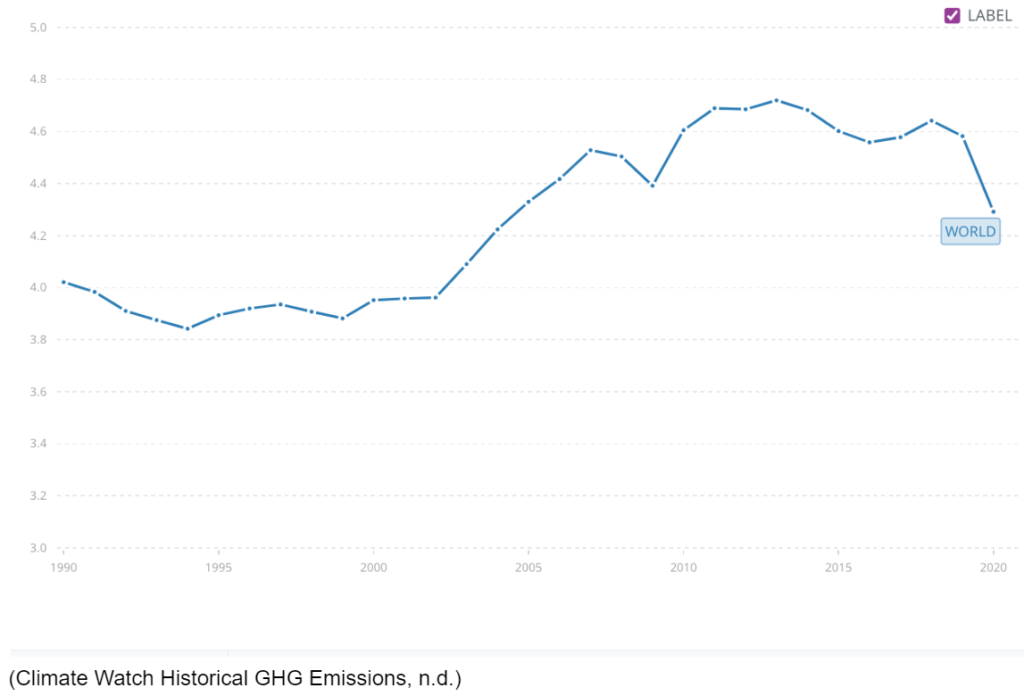
There has been a 66% increase in per capita pollution between 1960 and 2014. The total emissions are also greater because of a population boom. 1960 to 2014 was a period of strong economic growth and despite the development of new technologies, has failed to stop the rise of pollution. The last few years 2011 to 2015 show a leveling. Although this is only a short time range, it could be due to better global efforts to reduce pollution. (Pettinger 2021). From 2019 to 2020 there was a huge dip which could be the result of improved practices or because COVID-19 hit that year which resulted in a pause in economic growth. Economic growth leads to loss of biodiversity and resource depletion. This could harm the future ‘carrying capacity of ecological systems’ for the economy. Economic growth creates long-term toxins and waste, which may have unknown consequences. For example, economic growth has led to increased use of plastic, which does not degrade. So there is an ever-increasing stock of plastic in the environment and seas – which is both damaging to wildlife and unsightly.
The Ecological Footprint and Biocapacity
The ecological footprint is a way that tells how dependent humans are on natural resources. It is a measure that indicates how much resources from the environment are required to support a specific way of business or life. The ecological footprint is generally measured in global hectares (gha). Biocapacity is the capacity of ecosystems to produce useful biological materials and absorb waste materials generated by humans, using current management schemes and extraction technologies. The difference between the biocapacity and the Ecological Footprint of a region or country is that a biocapacity deficit occurs when the Footprint of a population exceeds the biocapacity of the area available to that population. Conversely, a biocapacity remainder exists when the biocapacity of a region exceeds its population’s Footprint. (WWF, n.d.)
Overshoot Day 2023
Earth Overshoot Day is the day of the year on which humanity’s demand for nature exceeds the Earth’s annual biological capacity to regenerate. In 2023, Earth Overshoot Day falls on August 2nd, meaning that between January 1st and August 2nd, humanity’s demand for biological regeneration is equivalent to the planet’s annual regeneration.
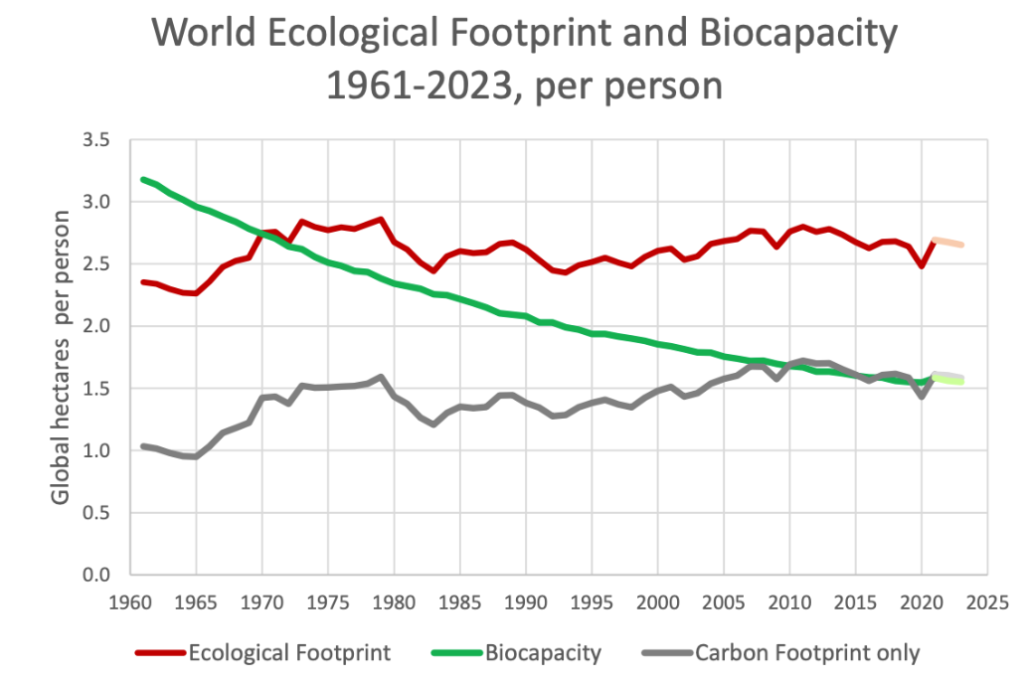
For 2023, the Ecological Footprint increased by 0.2 % compared to last year, while biocapacity increased by 0.3% over the same period. These effects decreased the ratio of Footprint to biocapacity by 0.1%. The carbon Footprint nowcast is based on CO2 emissions data from the International Energy Agency (IEA) and Carbon Monitor and ocean carbon sequestration data from the Global Carbon Project (GCP). As reported by IEA, the 2020 lockdowns induced by the global pandemic resulted in an initial sharp drop in CO2 emissions, but they increased again in the second half of the year. At the end of the year, total emissions were reported to be 5% lower than 2019 emissions. In 2021, emissions are estimated to have bounced back to the 2019 emissions levels. From 2021 to 2022, emissions are estimated to have increased an additional 1.5%. Carbon sequestration data from GCP, which includes cement carbonation sink, ocean sink, land sink, and land-use change emissions, is available until the year 2021. For 2022 and 2023 we assume that the data maintains the trajectory established since 2000. The most recent data from GCP shows that the carbon Footprint is foreseen to decrease by 0.3% from 2022 to 2023. The nowcast produced the following estimates. The biocapacity of the entire world in 2023 is estimated at 1.5 global hectares per person. Humanity’s Ecological Footprint is 2.6 global hectares per person, of which 60% is the carbon Footprint. (Earth Overshoot Day 2023)
Limitations of GDP as a Measure of Progress
Gross Domestic Product (GDP) is the total economic output achieved by a nation over some time. While GDP is generally a good indicator of a country’s standard of living, economic productivity, and financial well-being, it does come with shortcomings. Producers can grow their output by polluting or damaging the environment. In developed nations, production is better regulated, and companies that violate environmental laws can face severe penalties and fines. However, many developing countries rely on high output to support the growth of their economies and are less concerned with environmental issues. Nonetheless, there is a consensus that such environmental damage should be counted against a country’s GDP since it is not sustainable production and may impact future growth.
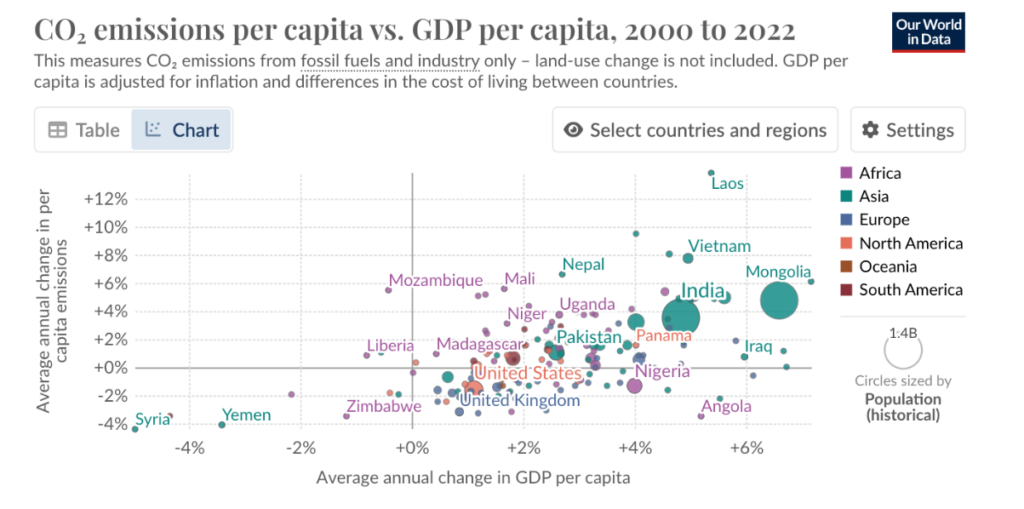
As indicated by the graph above, a larger GDP per capita usually shows a higher rate of per capita CO2 emissions. This shift is symptomatic of classifying environmental impacts as an externality, as rising emissions are not defined as detrimental to economic growth. Moreover, it can be seen that the countries with the most GDP per capita contribute the most to CO2 emissions. Developing nations that boost their GDP do not consider the negative impacts of their economic growth on the environment. However, developed countries like the United States and the United Kingdom with their policies and laws have been successful in limiting CO2 emissions while growing economically.
Alternative Indicators for a Comprehensive Assessment of Progress
Genuine Progress Indicator (GPI)
The Genuine Progress Indicator (GPI) is an economic tool used to calculate the health of a country’s economy. It incorporates social and environmental factors, such as benefits from higher education, family structure, pollution, and crime, which are not considered in the GDP. The GPI indicator takes everything the GDP uses into account and adds other figures that show the cost of the negative effects related to economic activity, such as the cost of crime, the cost of resource depletion, among others, and benefits from higher education. (Hyes 2023)
Human Development Index (HDI)
The Human Development Index (HDI), made by the United Nations Development Programme (UNDP), measures a country’s average achievements in three basic aspects of human development: education, income, and health. While HDI does not directly account for environmental sustainability, it does highlight the importance of investing in social infrastructure and human capital, which are essential for sustainable development.
Sustainable Development Goals (SDGs)
The United Nations’ Sustainable Development Goals (SDGs) offer a comprehensive framework for assessing progress across multiple dimensions, including economic, social, and environmental sustainability. The 17 SDGs cover areas such as poverty, health, education, clean energy, and climate action, providing a holistic approach to development. By aligning national policies with the SDGs, countries can pursue balanced and sustainable growth.
References
Climate Watch Historical GHG Emissions. n.d. “CO2 emissions (metric tons per capita) | Data.” World Bank Open Data. Accessed July 17, 2024. https://data.worldbank.org/indicator/EN.ATM.CO2E.PC.
Earth Overshoot Day. 2023. “Estimating the Date of Earth Overshoot Day 2023.” Earth Overshoot Day. https://www.overshootday.org/content/uploads/2023/06/Earth-Overshoot-Day-2023-Nowcast-Report.pdf.
Hyes, Adam. 2023. “Genuine Progress Indicator (GPI): Definition, Formula, Vs. GDP.” Investopedia. https://www.investopedia.com/terms/g/gpi.asp.
Pettinger, Tejvan. 2021. “Environmental impact of economic growth.” Economics Help. https://www.economicshelp.org/blog/145989/economics/environmental-impact-of-economic-growth/.
Sengupta, Somini. 2020. “Trump and the Teenager: A Climate Showdown at Davos (Published 2020).” The New York Times. https://www.nytimes.com/2020/01/21/climate/greta-thunberg-trump-davos.html.
WWF. n.d. “Nature’s regenerative capacity | WWF.” Panda.org. Accessed July 18, 2024. https://wwf.panda.org/discover/knowledge_hub/all_publications/living_planet_report_timeline/lpr_2012/demands_on_our_planet/biocapacity/.